What separates a truly great cycling city from one that merely tolerates bikes? After studying the world’s best cycling cities—from Copenhagen to Amsterdam, Utrecht to Tokyo—we’ve identified 5 essential criteria that consistently appear in places where cycling thrives.
Whether you’re a city planner, cycling advocate, or simply curious about what makes some cities so much better for cycling than others, understanding these criteria reveals the blueprint for building bike-friendly urban environments.
Let’s explore what truly makes a city great for cycling.
Criterion 1: Safe, Connected Infrastructure
The foundation of any great cycling city is high-quality, safe, and connected cycling infrastructure. This isn’t just about painting some bike lanes on roads—it’s about creating a comprehensive network that makes cycling safe, comfortable, and convenient for everyone.
What Great Infrastructure Looks Like
Protected Bike Lanes
- Physical separation from motor vehicles (not just paint)
- Raised cycle tracks at sidewalk level
- Protected intersections with dedicated signal phases
- Barriers: planters, bollards, or curbs—not just painted lines
Why it matters: Studies show protected bike lanes reduce cyclist injuries by 44% and increase ridership by 75% compared to painted lanes.
Connected Network
A cycling city needs a complete network without gaps:
- Routes connect residential areas to employment centers
- Links to schools, shops, parks, and transit stations
- Alternative routes for different skill levels
- Continuity across jurisdictions and neighborhoods
- Bridges or underpasses where needed
The test: Can an 8-year-old or an 80-year-old safely cycle from any point A to any point B in the city?
Quality Intersections
Intersections are where most cycling accidents occur. Great cities address this with:
- Protected intersections with corner refuge islands
- Dedicated bike signal phases (leading bike intervals)
- Clear sight lines and visibility
- Bike boxes at traffic lights
- Continuous bike paths through roundabouts
Surface Quality
- Smooth, well-maintained pavement
- Regular cleaning and snow removal
- Proper drainage (no puddles or ice)
- Clear lane markings and signage
- Adequate lighting for night riding
Real-World Examples
Copenhagen, Denmark:
- 390+ km of protected bike lanes
- 99% of bike lanes physically separated from cars
- Dedicated bike bridges and highways
- Result: 62% of residents cycle daily
Utrecht, Netherlands:
- World’s largest bike parking garage (12,500+ spaces)
- Bike lanes prioritized in road hierarchy
- Traffic signals timed for cycling speed (15 km/h)
- Result: 60% of trips under 7.5km made by bike
Criterion 2: Low-Speed, Calmed Traffic
Great cycling cities recognize that speed kills—literally. They systematically reduce motor vehicle speeds and prioritize vulnerable road users.
Traffic Calming Measures
Speed Limits
- 30 km/h (20 mph) default in residential areas
- 50 km/h maximum on urban arterials
- Lower speeds near schools, parks, and high-pedestrian areas
- Strict enforcement with speed cameras
The physics: At 30 km/h, 90% of pedestrians/cyclists survive collisions. At 50 km/h, 80% die.
Physical Traffic Calming
- Speed bumps and raised crossings
- Chicanes and road narrowing
- Shared spaces where bikes have priority
- Modal filters (block through-traffic, allow bikes)
- Raised intersections
Reduced Car Dominance
Great cycling cities actively de-prioritize cars:
- Remove parking spaces for bike lanes
- Reduce traffic lanes (road diets)
- Increase distance for car routes (while keeping bike routes direct)
- Congestion charges or low-emission zones
- Limited car access in city centers
The Dutch Model: “Sustainable Safety”
The Netherlands pioneered Sustainable Safety principles:
- Functionality: Separate roads by function (through-traffic vs. access)
- Homogeneity: Road users should have similar speeds and direction
- Predictability: Design should be intuitive and consistent
- Forgivingness: Infrastructure should minimize accident consequences
- State awareness: Drivers should be alert and capable
Result: Dutch cyclists are 5 times safer than American cyclists per km traveled.
Criterion 3: Abundant, Secure Bike Parking
You can’t have a cycling city without places to safely park bikes. Great cities provide abundant, convenient, and secure parking at every destination.
Types of Bike Parking
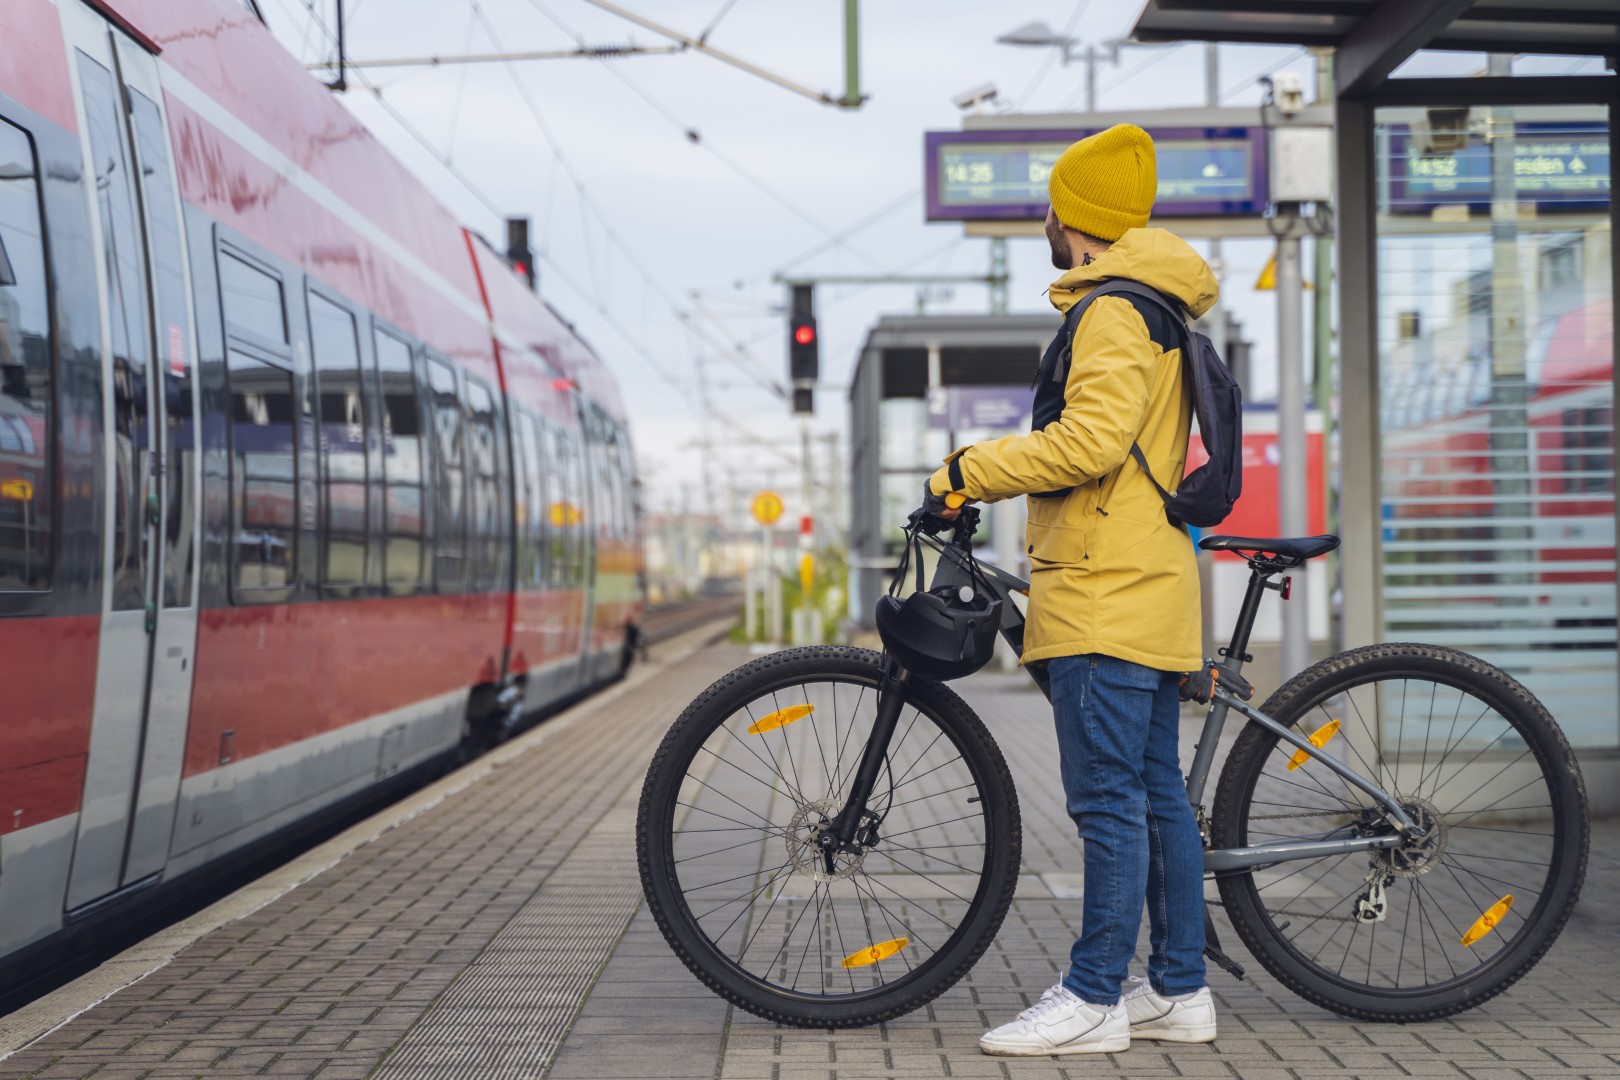
At Transit Stations
- Bike + Transit integration is crucial
- Covered, secure parking at train/metro stations
- Guarded facilities or bike lockers
- Automated bike parking systems
- Bike-share docking stations
Example: Tokyo has bike parking for 400,000+ bikes at rail stations.
In Public Spaces
- High-density bike racks on sidewalks
- Parklets replacing car parking spaces
- Bike corrals (protected bike parking areas)
- Covered bike parking at shopping districts
- Designated areas in parks and recreational spaces
At Private Buildings
Modern building codes should require:
- Bike parking in new residential buildings (1 space per unit minimum)
- Commercial buildings: employee bike rooms with showers/lockers
- Retail: short-term bike parking near entrances
- Schools: secure bike storage for students
Ratio matters: Copenhagen requires 2 bike parking spaces for every car space in new developments.
Security Features
- Well-lit, visible locations
- CCTV surveillance
- Sturdy racks that allow frame + wheel locking
- Bike lockers for valuable bikes
- Guarded facilities for long-term parking

Criterion 4: Supportive Policies and Funding
Infrastructure doesn’t build itself. Great cycling cities have strong political commitment backed by funding and supportive policies.
Budget Allocation
Cycling Investment
Top cycling cities invest significantly:
- Copenhagen: €35 million/year on cycling infrastructure
- Paris: €250 million cycling budget (2021-2026)
- Percentage of transport budget: 20-30% for cycling in leading cities
Return on investment: Every €1 invested in cycling infrastructure returns €4-5 in health benefits, reduced congestion, and environmental gains.
Policy Framework
Pro-Cycling Legislation
- Vision Zero: Commitment to zero traffic deaths
- Mandatory bike parking in new developments
- Bikes allowed on public transit
- Bike-first traffic signal priority
- Strict liability laws (drivers responsible in bike collisions)
Land Use Planning
- Mixed-use development: Reduce need for long trips
- Transit-oriented development
- Bike-friendly zoning codes
- Protect cycling routes in development plans
- 15-minute city principles
Political Will
Leadership Commitment
Successful cycling cities have leaders who:
- Set ambitious cycling modal share targets
- Defend cycling investments against opposition
- Lead by example (politicians cycling publicly)
- Engage citizens in planning processes
- Maintain long-term vision across political cycles
Case Study - Paris: Mayor Anne Hidalgo’s commitment:
- Created 1,000+ km of bike lanes (2020-2024)
- Removed 60,000 car parking spaces
- Made entire city center car-free on Sundays
- Result: Cycling trips increased 71% since 2019

Criterion 5: Strong Cycling Culture and Community
Infrastructure alone isn’t enough—great cycling cities have a vibrant cycling culture that makes riding a bike normal, desirable, and social.
What Cycling Culture Looks Like
Normalization
In great cycling cities, cycling is for everyone:
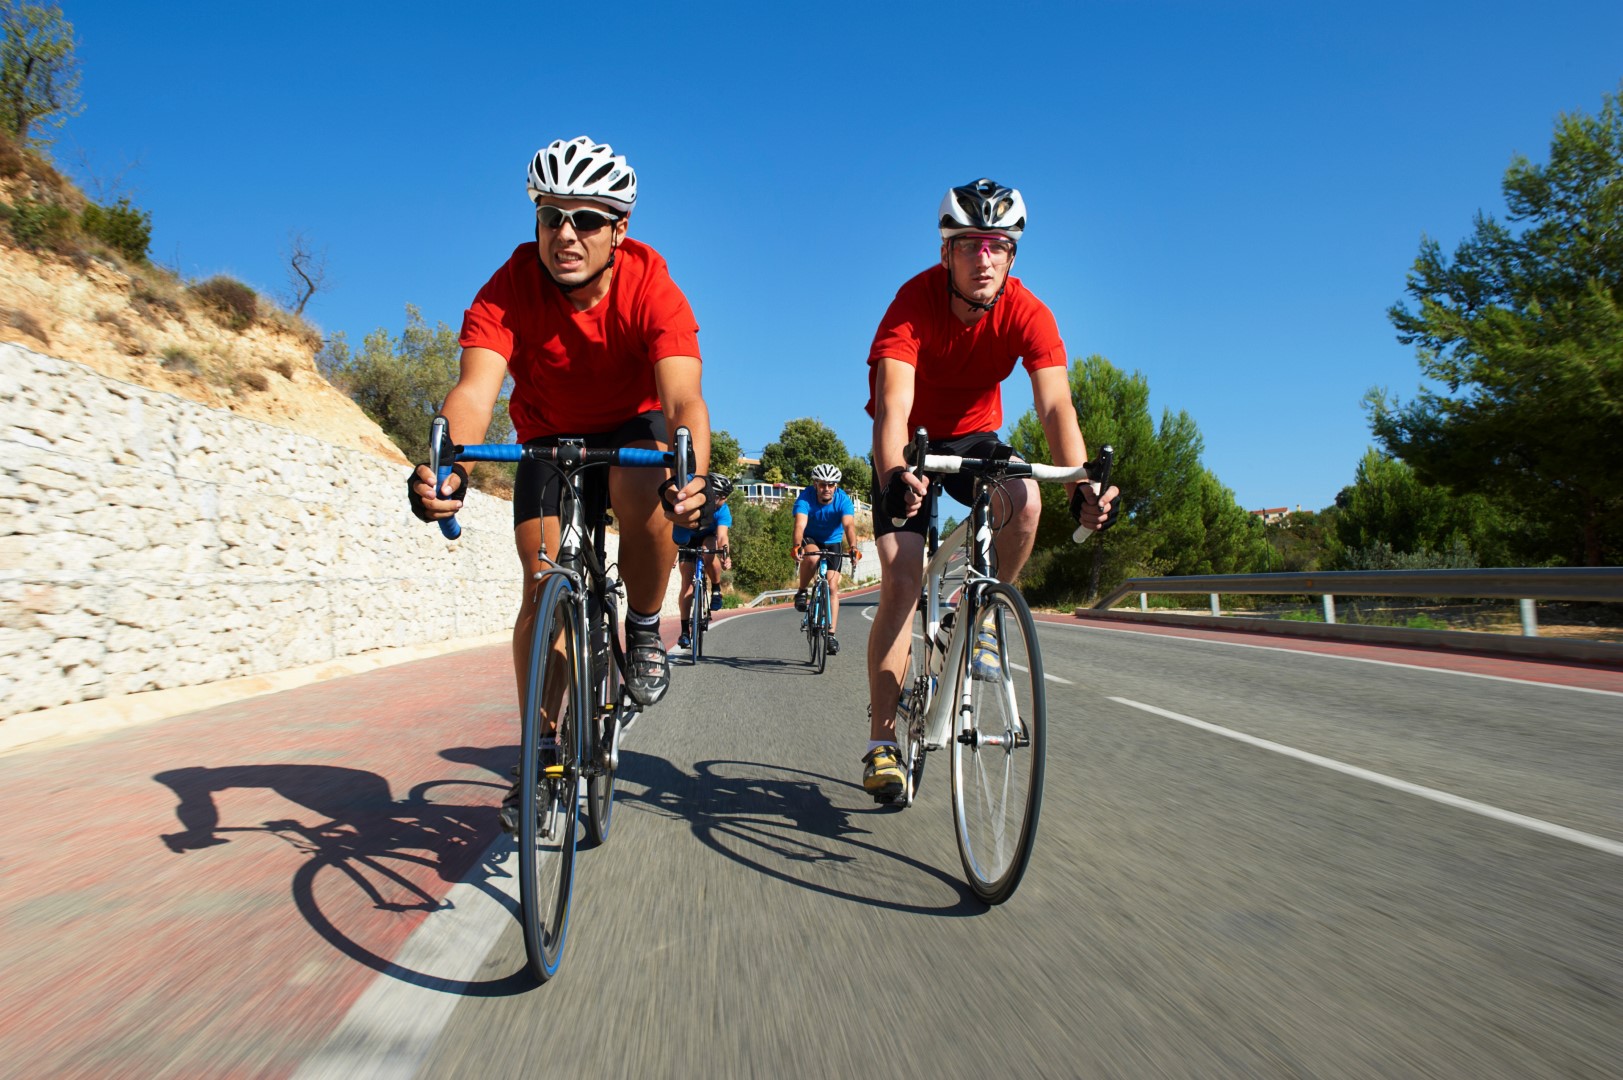
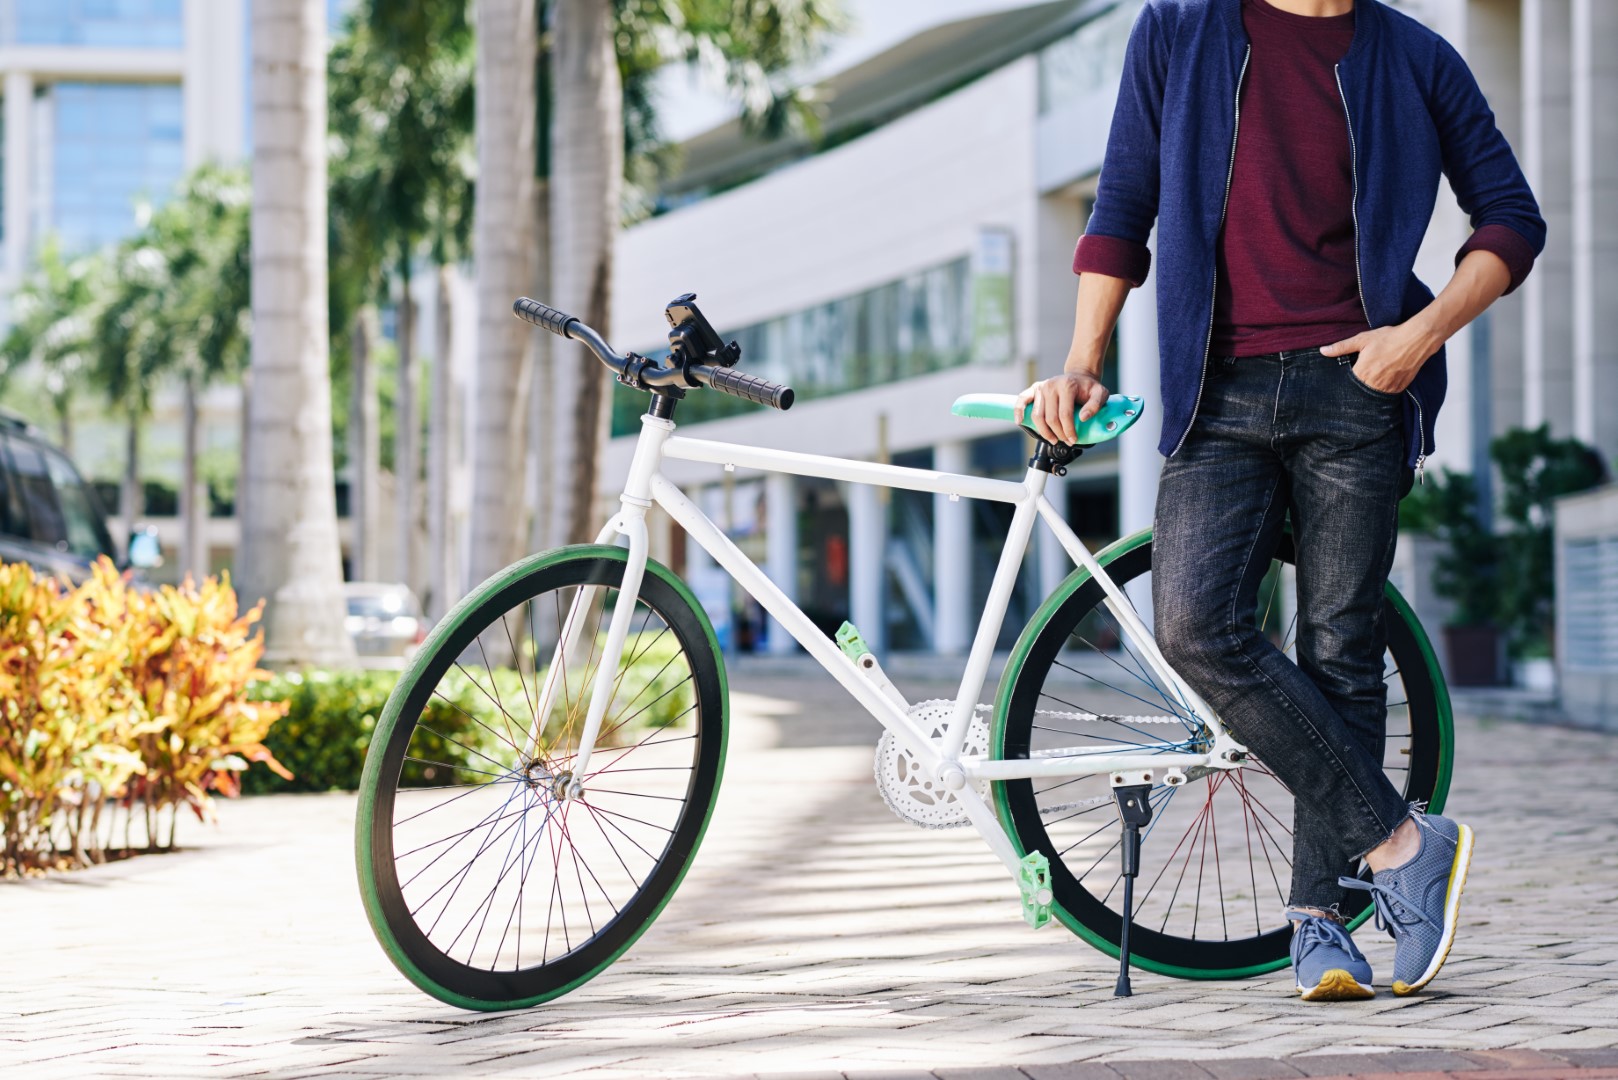
- Not just young, fit males—families, elderly, children
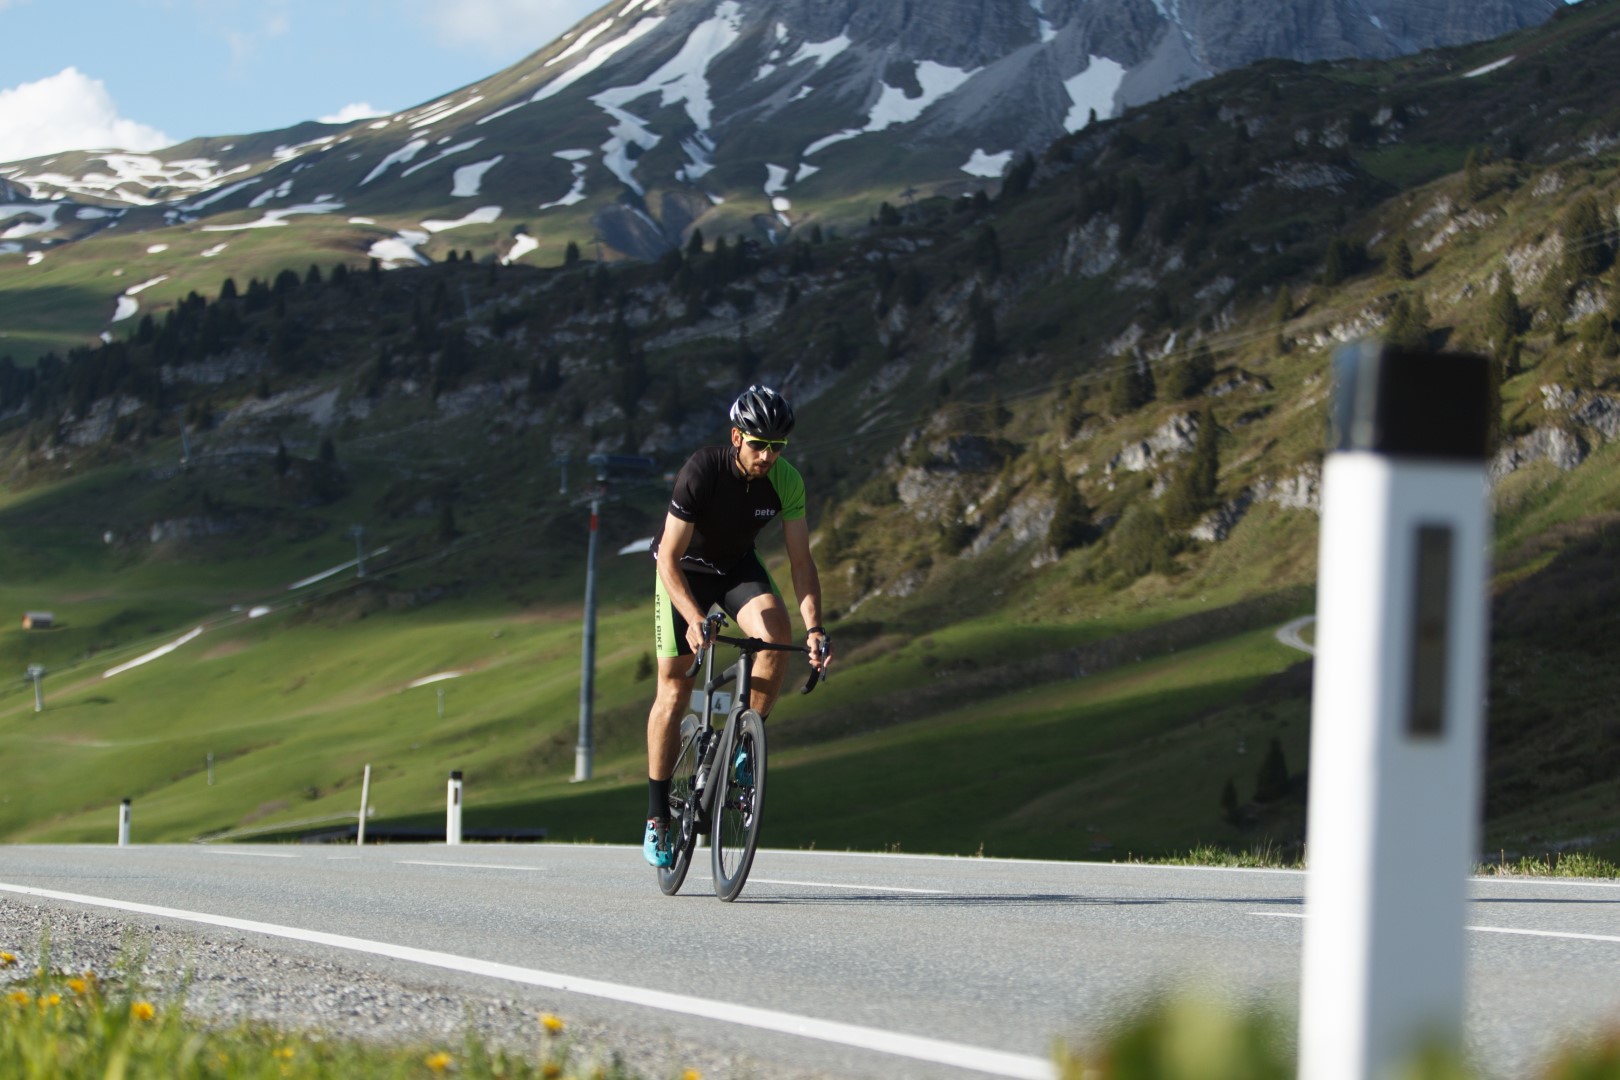
- Not just sport/recreation—primary transportation
- Normal street clothes, not specialized gear
- All bike types: cargo bikes, kid seats, adapted bikes
- Cycling in rain, snow, and all weather
Copenhagen example: 49% of cyclists are women (vs. 25% in typical cities).
Social Acceptance
Driver Behavior
- Respect for cyclists as legitimate road users
- Patient overtaking with safe distances
- Yielding to cyclists at intersections
- No aggressive horn use or harassment
- Cultural norm: cyclists have right of way
Community Events
Great cities foster cycling community through:
- Regular group rides and social cycling events
- Car-free days and open streets
- Cycling festivals and celebrations
- Bike-to-work/school campaigns
- Critical mass rides
Example: Bogotá’s Ciclovía closes 120 km of streets to cars every Sunday—1.5 million people participate.
Education and Encouragement
Cycling Education
- Bike safety taught in schools
- Adult cycling courses for beginners
- Bike maintenance workshops
- Traffic skills training
- Route planning assistance
Promotion Programs
- Bike-to-work incentives (tax benefits, subsidies)
- Employer cycling schemes
- E-bike purchase subsidies
- Bike-share systems
- Marketing campaigns normalizing cycling
Community Organizations
Cycling Advocacy
Strong advocacy organizations:
- Push for better infrastructure
- Engage citizens in planning
- Monitor and report issues
- Celebrate successes
- Provide community voice
Example: Dutch Cyclists’ Union (Fietsersbond) has 35,000+ members actively shaping policy.

Putting It All Together: The Cycling City Formula
Great cycling cities don’t excel at just one criterion—they excel at all five simultaneously:
The Virtuous Cycle
- Build safe infrastructure → More people feel safe cycling
- More cyclists → Political pressure for more infrastructure
- More infrastructure → Cycling becomes faster than driving for short trips
- Speed + convenience → Cultural shift toward cycling
- Cultural acceptance → Easier to implement bold policies
- Bold policies → Better infrastructure → The cycle continues
Common Mistakes Cities Make
❌ Painting bike lanes and calling it done (Need protection, not just paint) ❌ Building disconnected segments (Need complete network) ❌ Ignoring intersections (Most dangerous areas need most protection) ❌ No enforcement (Bike lanes blocked by cars/delivery trucks) ❌ Insufficient parking (Bikes need to go somewhere when you arrive) ❌ Treating cycling as recreation (Not recognizing it as transportation) ❌ One-time investment (Need sustained funding and maintenance)
The Timeline
Transforming a city takes time but shows results quickly:
- 6 months: Paint temporary protected lanes, see 20-40% ridership increase
- 2 years: Build permanent protected network, establish bike parking
- 5 years: Cultural shift visible, driving declines, safety improves
- 10 years: Cycling becomes dominant mode for short trips
- 20+ years: Complete transformation (Copenhagen/Amsterdam level)

Cities Leading the Way
Top 5 Cycling Cities (2024)
1. Utrecht, Netherlands
- 60% modal share for trips under 7.5km
- World’s best bike parking infrastructure
- Complete protected network
2. Copenhagen, Denmark
- 62% daily cycling rate
- 390+ km protected lanes
- Bike highways connecting suburbs
3. Amsterdam, Netherlands
- 36% modal share (all trips)
- 800,000+ bikes in city of 850,000
- Legendary cycling culture
4. Münster, Germany
- 43% modal share
- Students drive cycling culture
- Excellent integration with transit
5. Malmö, Sweden
- 30% modal share
- Rapid infrastructure growth
- Strong political commitment
Emerging Leaders
Cities rapidly improving:
- Paris, France: Revolutionary transformation since 2020
- Bogotá, Colombia: Leading developing-world cycling infrastructure
- Taipei, Taiwan: Asia’s cycling success story
- Seville, Spain: From 0% to 7% modal share in 10 years
- London, UK: Massive protected lane investment
How Your City Can Improve
For City Officials
- Start with a network plan (not piecemeal projects)
- Build protected infrastructure (not painted lanes)
- Allocate serious budget (20%+ of transport funding)
- Calm traffic speeds (30 km/h default)
- Measure and report progress (set targets, track results)
For Advocates
- Organize community (strength in numbers)
- Document problems (photos, near-miss reports)
- Propose solutions (be constructive, not just critical)
- Celebrate wins (acknowledge progress)
- Build coalitions (health, environment, business allies)
For Citizens
- Cycle more (be the change, build critical mass)
- Engage politically (attend meetings, contact representatives)
- Support local cycling orgs (join, volunteer, donate)
- Report issues (blocked bike lanes, dangerous infrastructure)
- Encourage others (invite friends, normalize cycling)
The Bottom Line
A great cycling city isn’t built overnight, but the formula is clear:
✅ Safe, connected infrastructure that protects cyclists ✅ Low-speed, calmed traffic that prioritizes people over cars ✅ Abundant bike parking at every destination ✅ Strong political commitment with sustained funding ✅ Vibrant cycling culture that makes riding normal and joyful
Cities that excel at all five criteria create environments where cycling becomes the obvious, easy choice for daily transportation—benefiting everyone through cleaner air, healthier citizens, less congestion, and more livable streets.
The question isn’t whether your city can become a great cycling city—it’s whether it has the vision and commitment to make it happen.
Join the Cycling Movement
Connect with local cyclists and advocate for better infrastructure.
Download Party Onbici🏙️ Transform Your City
Every great cycling city started with citizens demanding better. Whether you're a commuter, advocate, or city planner, you have the power to make cycling safer and more accessible in your community. Start by riding, keep going by organizing, and never stop pushing for the infrastructure and policies that make cycling the easy choice.
Cities are built for people, not cars. Let's reclaim our streets, one bike lane at a time.
Sources: