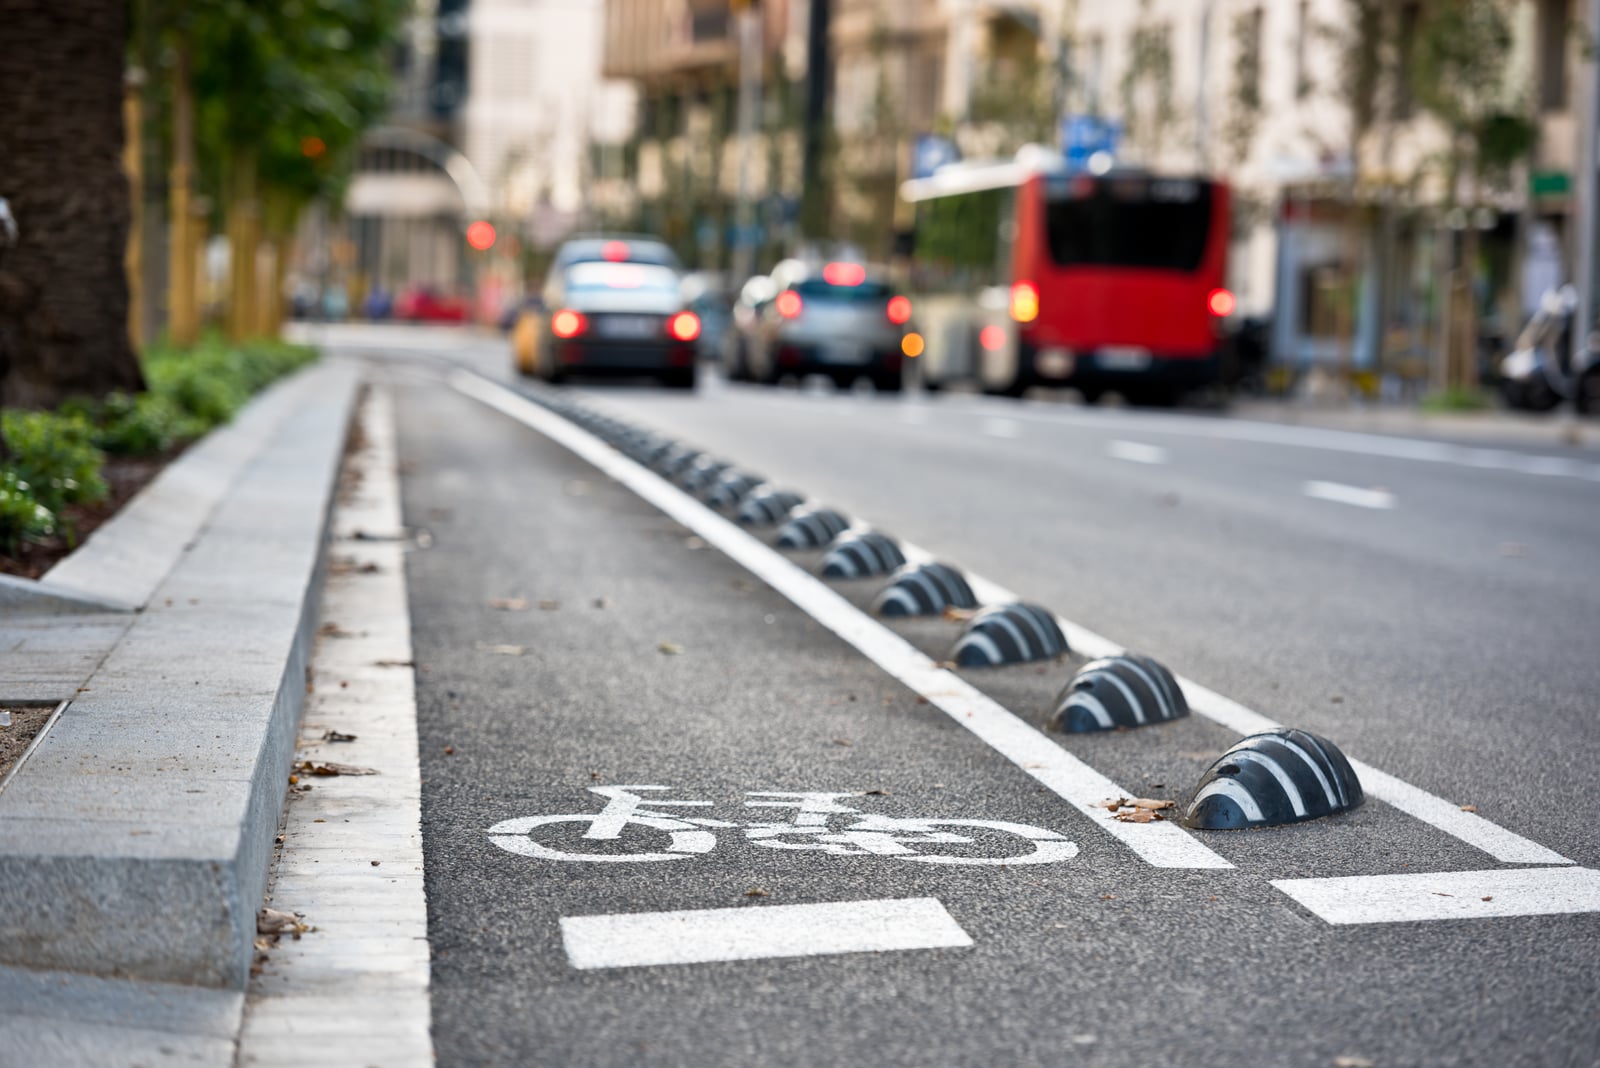
Ask any transport planner how they assess a cycling network and you’ll usually hear some version of the same process. You start with a desk review of the mapped network. You send a survey team to ride or walk the priority corridors, photographing and scoring each segment. Months later you get a report that ranks the worst stretches.
That process works. It’s also slow and expensive, and it only captures one moment. By the time the report is printed, a construction zone has closed a lane, a new path has opened and a patch of resurfacing has already cracked. And the survey only covered the corridors someone picked in advance.
Your residents already ride the whole network, every day. The Party Onbici app turns those everyday rides into a continuous audit of what the network is like to use.
Snapshot audits vs. continuous evidence
| One-off survey | Party Onbici | |
|---|---|---|
| Coverage | A few dozen kilometres of chosen corridors | Every street your riders actually use, plus the whole mapped network |
| Freshness | One point in time | Updated as new rides and reports arrive |
| Who collects it | A contracted survey crew | Residents, on rides they were already taking |
| What it shows | What’s there | What’s there, and how it feels to ride and where people want to go |
| Cost to repeat | Another survey | Nothing extra; it keeps running |
We see continuous evidence as a complement to engineering surveys, not a replacement. It tells your engineers where to look first.
Layer 1: The whole network, classified
Before a single ride is recorded, we classify the cycling network in your city from open map data. Each segment is sorted into one of five types:
- Protected: a cycleway separated from motor traffic
- Shared path: off the road, but shared with people walking
- Painted lane: a marked lane on the road
- Shared road: a signed route in mixed traffic
- Crossing
This matters because “we have 200 km of bike lanes” can mean very different things. A painted lane on a busy arterial and a separated cycleway are not the same thing to a parent riding with a child. Showing the network by type makes the gaps, sudden drops in protection and breaks in continuity visible at a glance.
Layer 2: What riders feel
When a rider records a ride, the phone quietly measures the street beneath them:
- Surface roughness. The phone’s motion sensors measure vibration and grade every stretch of the ride as smooth, normal, moderate or rough. Each phone is calibrated individually, so one bumpy phone mount doesn’t skew the results. The app also estimates the surface type: tarmac, brick, cobblestone or gravel.
- Safety signals. The app detects sudden impacts and sharp evasive swerves: the moment a rider has to dodge a car door, a pothole or a pedestrian stepping out.
Across many riders, individual readings build up into a citywide picture of comfort and risk. Surface data is combined into small street-level cells, each with a confidence score, so one ride on one afternoon doesn’t decide anything. Swerves and impacts are counted when we rank where new infrastructure is most needed.
No camera rig. No survey vehicle. No extra effort from the rider.
Layer 3: What riders see
Sensors can’t tell you why something went wrong. People can. When riders spot a problem, they can report it in under a minute, with the location, a category, a description and up to three photos:
- 🚗 Near misses
- 🕳️ Road hazards such as potholes, debris and slippery surfaces
- 🚦 Dangerous junctions
- 🚧 Obstructions such as blocked lanes, parked vehicles and construction
- 🔧 Infrastructure issues such as damaged paths, missing signage and poor design
- 💡 Lighting problems
Reports don’t disappear into an inbox:
- Officials for the area are notified of new reports.
- Officials can respond publicly, add internal notes and track status from pending through review to resolved.
- Riders see the outcome of what they reported, which builds trust and keeps people reporting.
- Public reports feed an open hazard heatmap, so riders and council staff are looking at the same map.
Riders can report publicly, anonymously or privately to officials. Location metadata is removed from every photo on our servers before anyone else sees it, and a photo is rejected if that can’t be done.
Layer 4: The context around the street
A street can be smooth and still feel unsafe at night or unbearable in summer. So we add further layers of evidence to the same map:
- Road lighting evidence. Mapped street lamps and lighting tags are combined with satellite night-light data. We never claim a street “has lights” when we can’t back it up; streets we can’t assess are marked as unknown.
- Tree canopy and shade, to show which busy corridors would benefit most from street trees.
- Population and destinations, such as schools, shops and transport stops, so you can see who a new connection would actually serve.
From evidence to a priority list
All of this comes together in Location Analytics, a map built for city officials. It compares where people ride and want to go with the infrastructure that exists today, and it highlights:
- 🔗 Missing links: short gaps that cut off otherwise connected routes
- 🛣️ Suggested lanes, ranked by demand and by the number of residents they would connect
- 💡 Lighting and 🌳 shade opportunities on well-used corridors
- 🅿️ Amenity gaps, including bike parking, repair stations, drinking water and toilets
Each suggestion comes with a conservative, moderate and ambitious forecast: potential new riders, CO₂ avoided, health value, fuel and money saved, and a net present value. Each forecast states the assumptions behind it.
The results can be exported as a council report in HTML, PDF, CSV or Excel, ready for a briefing, a budget bid or a grant application.
A scorecard you can track over time
To see the bigger picture, the City Cycling Index gives your city a 0–100 infrastructure score made up of six sub-scores, each tied to a concrete lever:
- Coverage: how much quality-weighted cycling infrastructure you have
- Connectivity: how much of your low-stress network actually joins up
- Access: the share of residents living within 300 m of a traffic-free route
- Amenities: parking, repair, water and toilets
- Ridership and safety: these two will be driven by ride data, and are clearly marked as pending until there is enough of it
The index is clipped to your real administrative boundary, recalculated as new data arrives and tracked week by week. It carries a confidence badge that says openly where the underlying data is thin. You can share a public scorecard with councillors or residents without giving anyone access to your dashboard.
We’re deliberate about what the index claims. It measures infrastructure provision, not how many people ride. It’s a planning tool that shows where your network is weak and what to build next, not a league table.
Bringing residents into the conversation
Evidence persuades. Involving residents builds the support a project needs to happen. Our Community Consultation Map lets residents drop pins where they want improvements, vote on each other’s suggestions and comment. The results export as a council-ready report, rather than a pile of emails to sort through.
Privacy and data sovereignty, built in
Everything a city sees is aggregated. Individual ride traces are never published. Data stays in its region: Australian data is stored in Australia and European data in the EU, under GDPR.
What a pilot looks like
- We set up your city. We load your boundary, map network, population and destinations, and your City Cycling Index is calculated straight away.
- Your riders start riding. Local cycling groups, workplaces and schools use the app for rides they already take, including group rides and bike buses.
- Evidence builds up. Surface data, safety signals and resident reports fill in the map week by week.
- You act on it. Your team uses Location Analytics and council reports to prioritise fixes, justify funding and show progress.
Because it keeps running, the second year costs you nothing extra to measure, and you can see whether what you built made a difference.
Want to see what your city’s network looks like through the eyes of the people who ride it? Talk to us about a pilot »