See where cycling could work better, activate promising corridors and measure what happens.
Party Onbici combines city-scale cycling analysis with real-world community participation — helping cities decide where to focus and learn from how people actually ride.
Explore the City Cycling Index → · Discuss a pilot →
See it in one minute
Narrated in your language, with captions.
Read the transcript
Party Onbici helps cities turn cycling data into action. First, understand the network — cycling access, connectivity, destinations and infrastructure in one view. Then identify corridors where targeted changes could connect more people to everyday destinations.
Next, activate those corridors with community rides, recurring programs and Bike Buses — helping people actually try the route together.
Then measure participation, rider feedback, access and estimated environmental outcomes, using aggregate insights rather than individual ride histories. From network analysis to real-world cycling activity — and back into better decisions. Party Onbici: understand, prioritise, activate and measure.
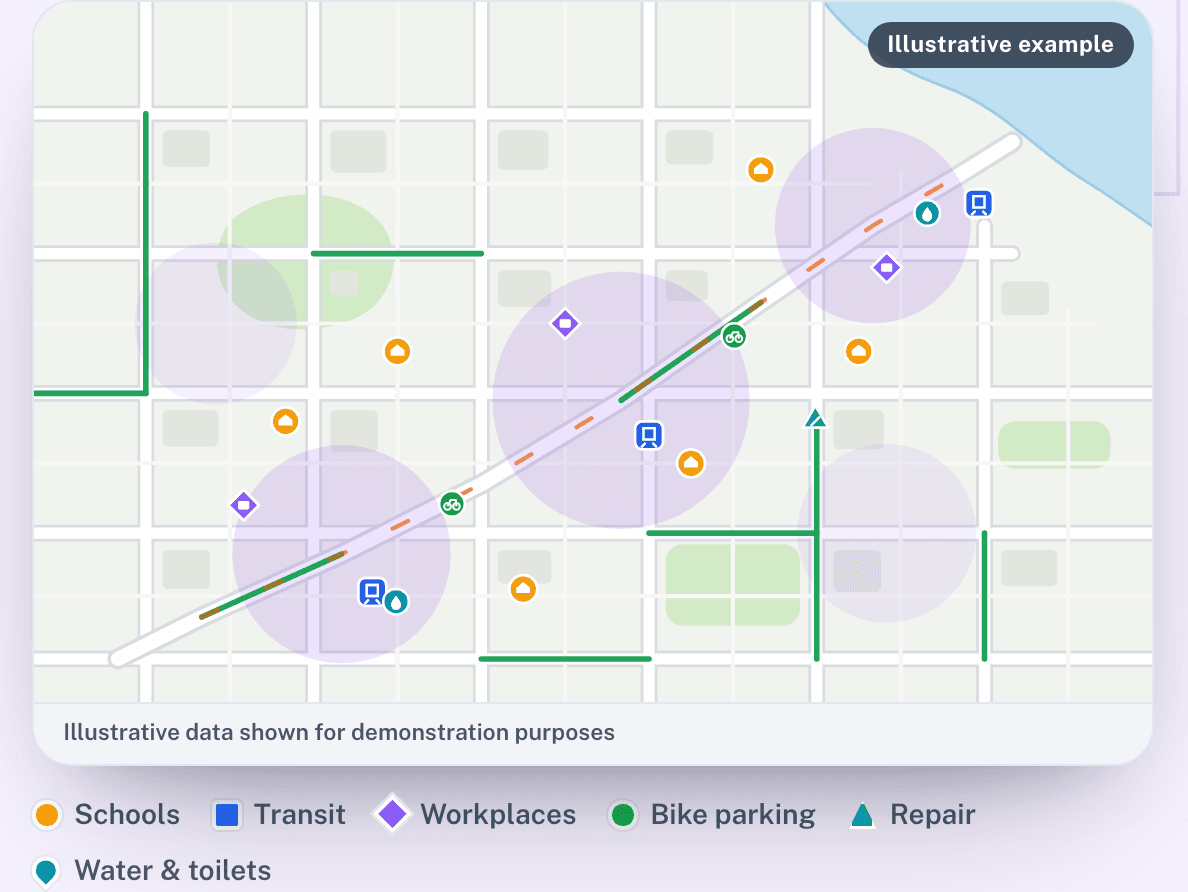
1. Understand the network
Bring cycling access, connectivity, destinations and infrastructure into one view.
Start with the city as it is today.
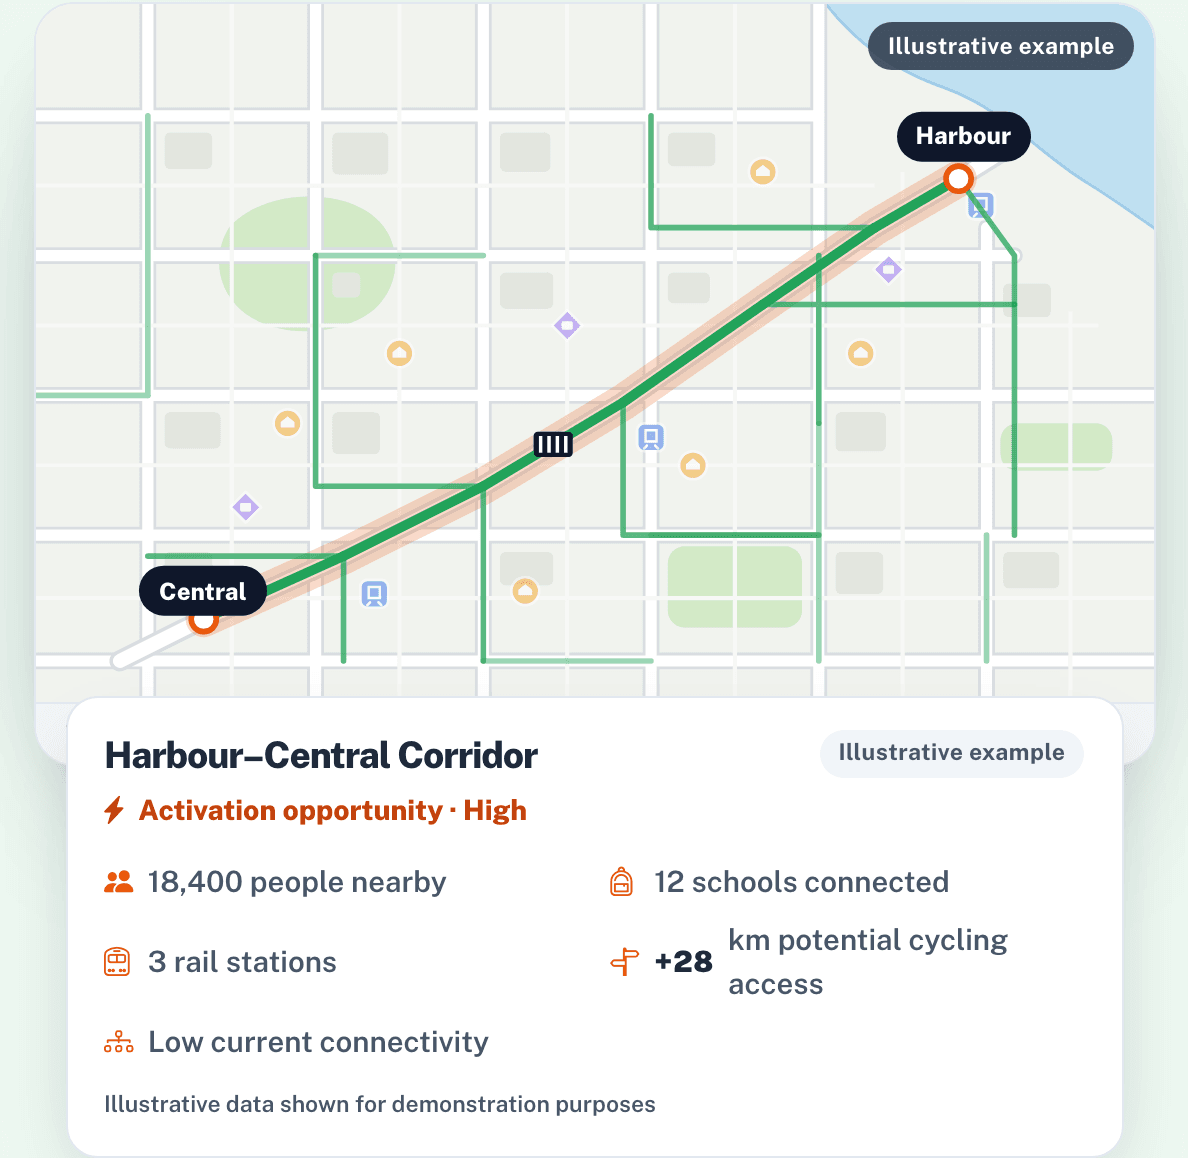
2. Prioritise opportunities
Find corridors where targeted changes could unlock more cycling access.
Focus investment where it can connect people to more places.
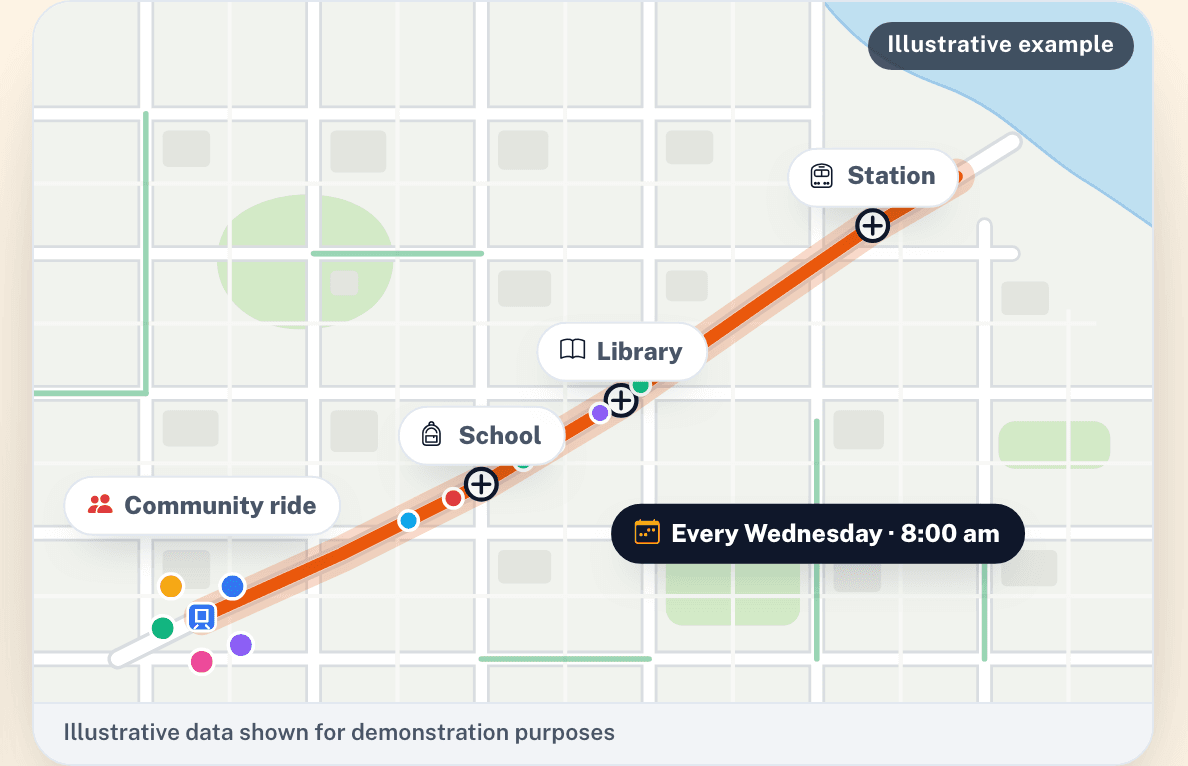
3. Activate the corridor
Turn analysis into real participation with rides, Bike Buses and community activation.
Move from showing where people could ride to helping them try the route together.
- 3 community rides
- 1 Bike Bus
- 42 participants
- Recurring weekly
Illustrative data shown for demonstration purposes
4. Measure what changes
Learn from participation, route activity and rider feedback.
See what attracted riders, where friction remains and what to improve next.
City insights are aggregated and anonymised. Individual ride paths are not exposed to city users.
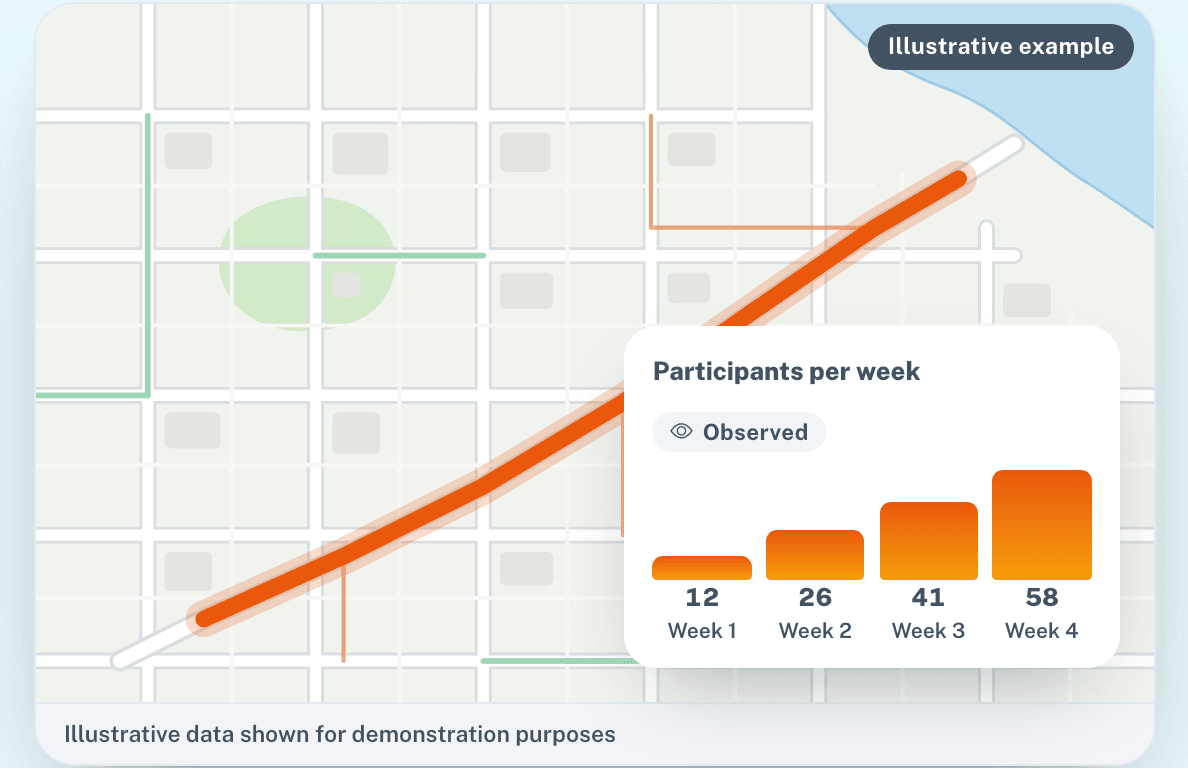
| Before pilot | During pilot | |
|---|---|---|
| Pilot participants | 0 | 84 (Observed) |
| Repeat riders | — | 41 % (Observed) |
| Baseline trips observed | 18 | 126 (Observed) |
| Safety perception | 56 / 100 | 72 / 100 (Rider survey) |
| Riders reporting a stressful section | 47% | 22 % (Rider survey) |
| Reachable low-stress network | 41 km | 69 km (Modelled) |
| Interventions in place | 0 | 4 (Modelled) |
| CO₂ avoided | 0 kg | 214 kg (Estimated) |
| Corridor activity | Low | Growing (Estimated) |
Illustrative data shown for demonstration purposes
That’s Party Onbici for cities.
Understand → Prioritise → Activate → Measure
From network analysis to real-world cycling activity — and back into better decisions.
Explore the City Cycling Index → · Discuss a pilot →
Benchmark cycling access
A consistent city-level view of how easy it is for people to reach destinations by bike.
Explore the methodology → · View cities →
Start at any scale
Test one corridor, one school network or an entire city.
Corridor
Test how a specific missing link or route could improve cycling access.
- Station connection
- School corridor
- Employment precinct
- Town centre access
Community
Activate a defined community with recurring rides and targeted programs.
- Schools
- Universities
- Workplaces
- Neighbourhoods
City
Benchmark cycling access, identify priority areas and track improvement over time.
- City Cycling Index
- Priority areas
- Progress over time
From maps to evidence
Different teams need different answers.
Active transport
Where are the highest-value network gaps?
Strategic planning
Which corridors connect the most people to everyday destinations?
Sustainability
What travel emissions could a shift to cycling potentially avoid?
Community engagement
Where do people feel comfortable — and where don’t they?
Schools
Where could Bike Bus routes connect students safely?
Public health
Where can everyday activity become easier to access?
Insights without tracking people
Party Onbici gives cities aggregate insights, not a window into individual riders.
Participation, route activity and feedback can be analysed in aggregate while individual ride histories remain private.
What could more cycling look like in your city?
Start with the network you already have. Identify the opportunities. Put riders on them. Learn what happens.
Explore Party Onbici for cities → · Discuss a pilot →
Want to try it yourself? The interactive version is on our website: Turn cycling data into action.