In 2010, Paris had a 3% cycling modal share. By 2023, it was 11.2% — and cycling trips had increased by 240%. The city now records approximately 1 million cycling trips per day across the Ile-de-France region.
Copenhagen has 390+ km of protected bike lanes and a 62% daily cycling rate. Amsterdam has 800,000 bikes in a city of 850,000 people.
Italian cities look at these numbers and see an impossible gap. But the gap is smaller than it appears — and the path across it is clearer than most officials realise. Milan, Bologna, and other Italian cities are already on the same trajectory. The question is whether they’ll learn from what made Europe’s cycling capitals successful, or repeat the mistakes that slowed other cities down.
The most important lesson? The cities that built the best cycling infrastructure also built the best cycling data.
Paris: The Transformation Model
Paris is the most relevant comparison for Italian cities. It’s not a flat Dutch city with decades of cycling culture. It’s a dense, car-dominated European capital with narrow streets, aggressive drivers, and a population that considered cycling impractical until very recently.
What Paris Did
Under Mayor Anne Hidalgo, Paris invested EUR 250 million in its Plan Velo (2021-2026):
- Built over 1,000 km of cycling infrastructure
- Removed 60,000 car parking spaces
- Created the REVe network — a grid of protected cycling highways across the city
- Expanded Velib’ to 20,000 bikes — one of the world’s largest bike-share systems
- Made the entire city centre car-free on Sundays
What Happened
- Cycling traffic increased 240% between 2018 and 2023
- Daily bike trips tripled between 2010 and 2022
- Cycling modal share reached 11.2% — surpassing car trips at 4.3%
- Air pollution dropped by approximately 50%
The Key Insight
Paris didn’t just build infrastructure and hope for the best. The city invested heavily in measurement — counting stations, traffic surveys, and data platforms that tracked cycling growth in real time. This data served two critical functions:
- Planning: Identifying where the next investments should go, based on actual demand and network gaps
- Political protection: When opposition mounted (and it did, fiercely), the city had hard numbers to demonstrate that the infrastructure was being used and delivering results
Italian cities face the same political dynamics. Comprehensive cycling data is the difference between infrastructure that survives opposition and infrastructure that gets removed.
Copenhagen and Amsterdam: The Gold Standard
What Makes Them Different
Copenhagen and Amsterdam didn’t become cycling cities overnight. Amsterdam’s transformation began in the 1970s, driven by citizen protests after a wave of child traffic deaths. Copenhagen’s cycling infrastructure has been built systematically over four decades.
What sets them apart isn’t just the infrastructure — it’s the data culture:
- Copenhagen publishes a biennial Bicycle Account — a comprehensive public report tracking cycling modal share, rider satisfaction, safety statistics, and infrastructure investment. This transparency creates accountability and public trust.
- Amsterdam uses a network of counting stations, surveys, and digital tools to continuously monitor cycling patterns across the city. Infrastructure decisions are evidence-based by default.
- Both cities track demographics — understanding that cycling infrastructure must serve women, children, elderly residents, and people with disabilities, not just fit commuters.
The Lesson for Italy
The lesson isn’t “be like Copenhagen” — it’s build the data infrastructure alongside the physical infrastructure. Every km of bike lane should come with a plan to measure its impact. Every intersection improvement should have baseline data to compare against.
Italian cities are at the beginning of their cycling transformation. They have a choice: build the data foundation now, or spend years trying to retrofit it later.

Where Italy Stands Today
Milan: On the Paris Trajectory
Milan’s Strade Aperte plan and subsequent Cambio Biciplan (750 km of metropolitan cycle highways by 2035) put the city on a Paris-like trajectory. Corso Buenos Aires recording 10,000 cyclists per day — a 122% increase — mirrors the early results Paris saw when it built protected lanes on major boulevards.
Milan’s challenge now is scaling. Moving from 35 km of tactical urbanism lanes to a 750 km metropolitan network requires knowing exactly where the next investments will have the greatest impact. That’s a data question.
Bologna: Proving Traffic Calming Works
Bologna’s Città 30 results — zero pedestrian deaths, 10% increase in cycling, 69% surge in bike-sharing — demonstrate that traffic calming and cycling growth are deeply connected. The city has proven the concept. Now it needs data to identify where dedicated cycling infrastructure should complement the lower speed limits.
Rome: Breaking Through
Rome’s GRAB project (50 km circular cycle path) is a bold statement of intent. But Rome is starting from a much lower base than Milan or Bologna — and faces steeper cultural and topographical challenges. Data showing where Romans are already riding (and where they want to ride but can’t) would transform the GRAB from a standalone project into the backbone of a data-driven cycling network strategy.
The Emerging Italian Cycling Cities
Beyond the big three, cities like Turin, Florence, Padova, and Ferrara are all investing in cycling infrastructure. Each faces the same questions: where to build, who will use it, and how to prove it works. The cities that answer these questions with data will build better infrastructure and build it faster.
Five Lessons From Europe’s Leaders
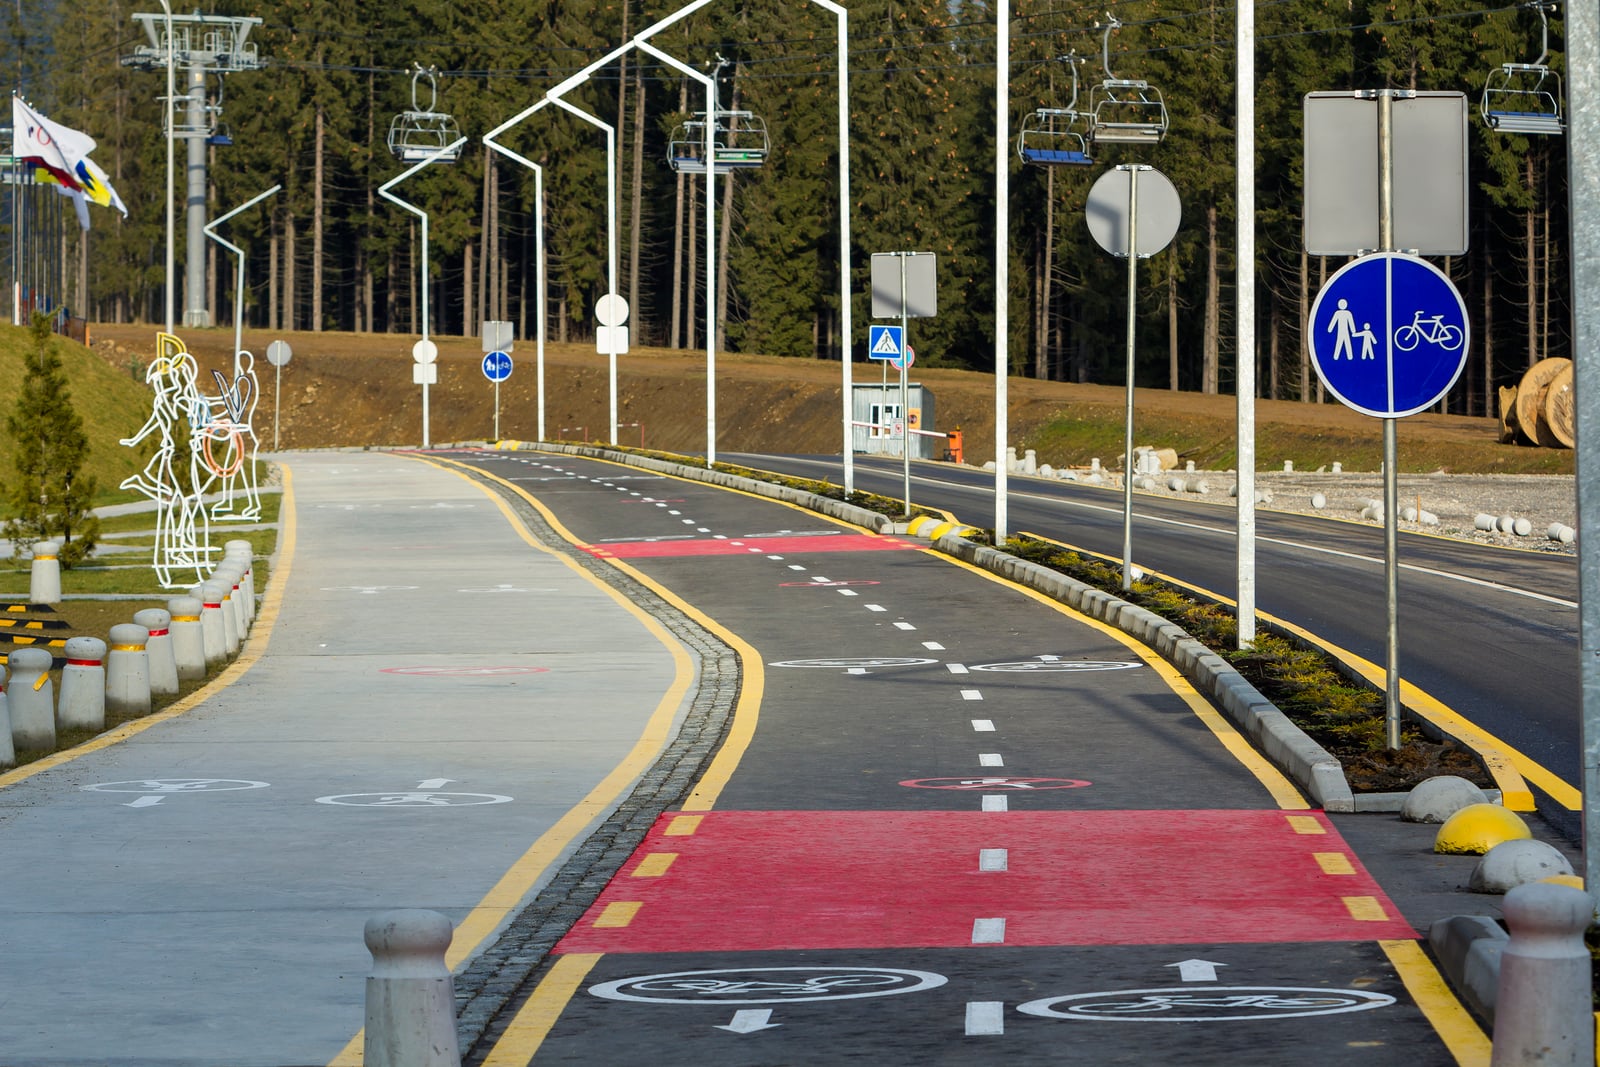
1. Build Networks, Not Segments
Copenhagen and Amsterdam’s cycling infrastructure works because it’s a connected network, not isolated segments. Paris learned this lesson and designed the REVe network as a grid covering the entire city.
Italian cities should plan their cycling investment as network completion — identifying and filling the gaps that prevent existing infrastructure from functioning as a coherent whole. Crowdsourced route data reveals these gaps by showing where riders are forced off safe infrastructure onto dangerous roads.
2. Measure From Day One
Every successful cycling city measures relentlessly. Counting stations, surveys, and data platforms are not afterthoughts — they’re built into the infrastructure strategy from the beginning.
Italian cities have an advantage here: they can skip the expensive fixed-counter approach and go straight to crowdsourced smartphone data — getting network-wide coverage, demographic insights, and real-time feedback at a fraction of the cost.
3. Use Data as Political Armour
Paris faced enormous opposition to its cycling investments. What protected Hidalgo’s policies was data showing they worked — ridership numbers, safety improvements, air quality gains, and economic benefits that opponents couldn’t credibly dispute.
Italian cities will face the same opposition. Bologna’s Città 30 already has — despite achieving zero pedestrian deaths, Italy’s national government challenged the policy. Data is the best defence.
4. Design for Everyone, Not Just Enthusiasts
Copenhagen’s cycling success is measured by the fact that 49% of its cyclists are women. The city designs infrastructure for the 8-year-old and the 80-year-old, not just the fit commuter.
Italian cities need demographic data to ensure their investments attract diverse riders. If new infrastructure is only used by the same male, sport-oriented demographic, it’s not fulfilling its potential — and it’s not building the broad political constituency needed to protect future investment.
5. Start Fast, Then Iterate
Paris built its initial protected lanes using tactical urbanism — temporary barriers, paint, and planters that could be installed in weeks. Data from these temporary installations then informed permanent infrastructure design.
Milan’s Strade Aperte followed the same approach. It works because it’s low cost, fast to deploy, and generates data immediately — data that informs the next iteration and builds the evidence base for permanent investment.
Italy’s Cycling Moment
Italy has more cycling investment funding than at any point in its history. It has cities demonstrating that transformation is possible. It has a cycling tourism market generating nearly EUR 10 billion annually and growing at double-digit rates.
What it needs now is the data infrastructure to match its physical infrastructure ambitions. The cities that build both together — as Paris, Copenhagen, and Amsterdam did — will transform. The cities that build infrastructure without data will be building on sand.
Build Your Data Foundation
Start measuring cycling demand across your city's network.
Contact Party OnbiciFor Italian City Officials
Europe's cycling capitals didn't become cycling capitals by accident. They built infrastructure and measured its impact from day one. Italian cities are at the beginning of the same journey — and they have the opportunity to leapfrog by adopting modern data tools from the start. Don't build infrastructure first and figure out measurement later. Build both together.
Paris proved that any car-dominated European city can transform. Data is how you make the transformation stick.
Sources:
- How Paris Raised Bike Ridership 54 Percent in One Year — PeopleForBikes
- New Study Shows How Paris Pedaled Its Way to a Cycling Revolution — Momentum Mag
- Paris cycling investment helps cut pollution in half — Momentum Mag
- Increase in Paris cycle lanes leads to dramatic rise in bike commuting — Transport & Environment
- Strade Aperte: how Milan plans to reduce cars — LifeGate
- One year at 30 km/h: Bologna changes pace and wins — FIT Consulting
- GRAB — European Commission project page
- Copenhagenize Index: Global Bicycle Cities Ranking
- CROW Design Manual for Bicycle Traffic (Netherlands)